【Linux】Linux 性能
引言
干货不是一般的多。
参考资料
https://www.brendangregg.com/linuxperf.html
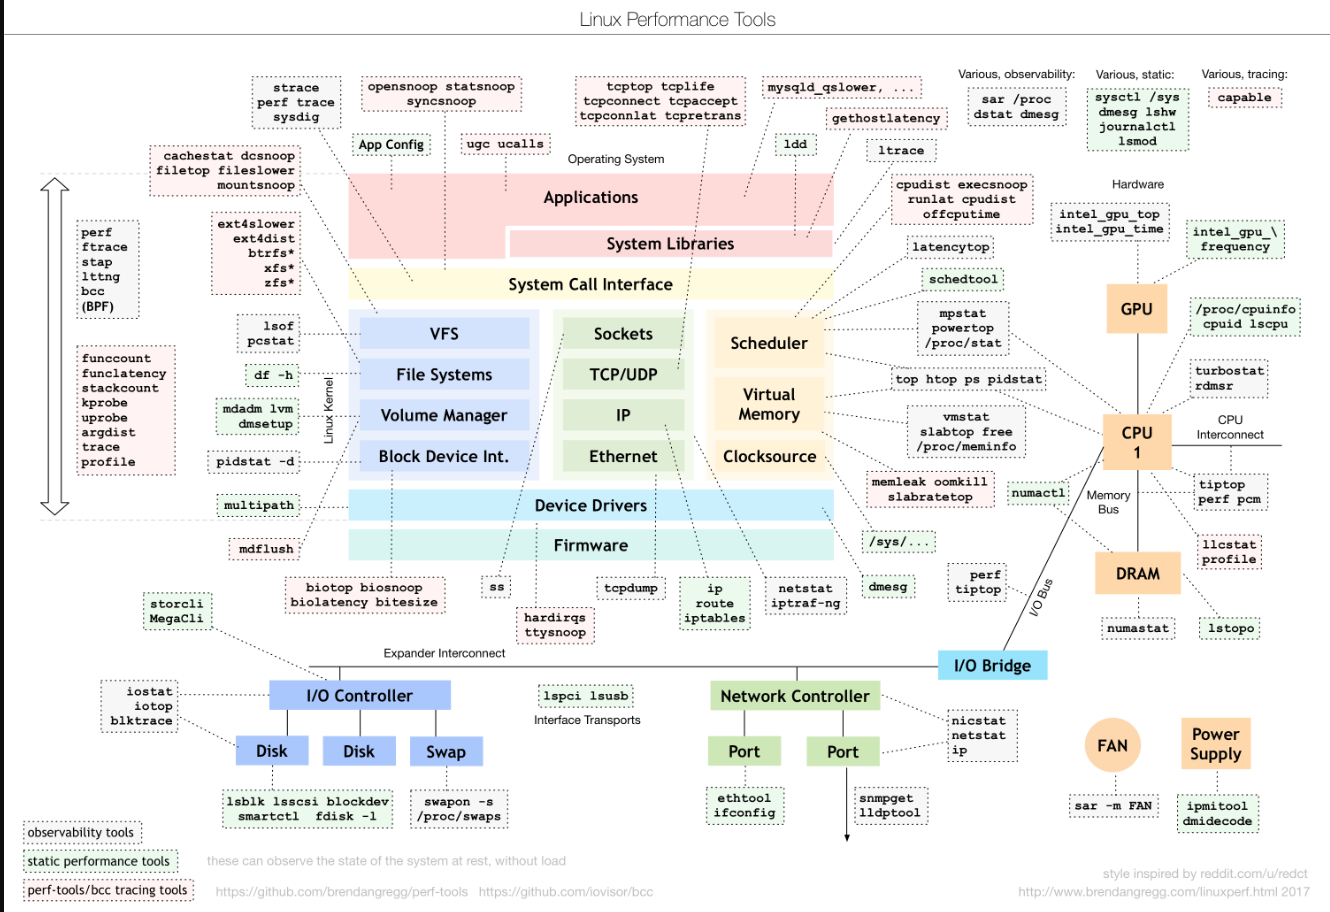
This page links to various Linux performance material I’ve created, including the tools maps on the right. These use a large font size to suit slide decks. You can also print them out for your office wall. They show: Linux observability tools, Linux static performance analysis tools, Linux benchmarking tools, Linux tuning tools, and Linux sar. Check the year on the image (bottom right) to see how recent it is.
本页链接到我制作的各种 Linux 性能材料,包括右侧的工具图。这些地图使用大号字体,适合幻灯片使用。你也可以打印出来贴在办公室墙上。它们显示 Linux 可观察性工具、Linux 静态性能分析工具、Linux 基准测试工具、Linux 调试工具和Linux sar。请查看图片(右下角)上的年份,了解其最新版本。
There is also a hi-res diagram combining observability, static performance tuning, and perf-tools/bcc: png, svg (see discussion), but it is not as complete as the other diagrams. For even more diagrams, see my slide decks below.
还有一个结合了可观察性、静态性能调优和 perf-tools/bcc 的高清图表:png、svg(见讨论),但不如其他图表完整。需更多图表,请参阅下面的幻灯片。
On this page: Tools, Documentation, Talks, Resources.
png
svg(注意只有部分)
在本页中:Tools, Documentation, Talks, Resources.
Tools
- perf: perf one-liners, examples, visualizations. (perf 、实例、可视化。)
- eBPF tools: BPF/bcc tracing tools and examples. (BPF/bcc 跟踪工具和示例)
- perf-tools: Ftrace perf tools (github). (Ftrace perf 工具(github))
- bcc: BPF/bcc perf tools (github). (BPF/bcc perf 工具(github))
- bpftrace: BPF/bpftrace perf tools (github).(BPF/bpftrace perf 工具(github)。)
- Flame Graphs: using perf and other profilers.(使用 perf 和其他剖析器。)
Documentation
- Linux Performance Analysis in 60,000 Milliseconds shows the first ten commands to use in an investigation (video, PDF). Written by myself and the performance engineering team at Netflix (2015).
Linux Performance Analysis in 60,000 Milliseconds 显示了调查中使用的前十个命令(视频, PDF)。由我本人和 Netflix 的性能工程团队撰写(2015 年)。
- My post Performance Tuning Linux Instances on EC2 includes the tunables we’re using at Netflix (2015).
我的文章 Performance Tuning Linux Instances on EC2包含了我们在 Netflix 使用的可调性(2015 年)。
- A post on Linux Load Averages: Solving the Mystery, explaining what they are and why they include the uninterruptible sleep state (2017).
关于[Linux 负载平均值:解开之谜]的帖子(https://www.brendangregg.com/blog/2017-08-08/linux-load-averages.html),解释了什么是负载平均值以及为什么包含不间断睡眠状态(2017 年)。
A gdb Debugging Full Example (Tutorial), including the use of some perf/debugging tools (2016).
gdb 调试完整示例(教程)](https://www.brendangregg.com/blog/2016-08-09/gdb-example-ncurses.html),包括一些 perf/debugging 工具的使用(2016 年)。
The book Systems Performance: Enterprise and the Cloud, 2nd Edition (2020) covers performance analysis methods and Linux tools, including perf, Ftrace, and eBPF.
系统性能:企业与云,第 2 版 (2020)](https://www.brendangregg.com/systems-performance-2nd-edition-book.html) 一书介绍了性能分析方法和 Linux 工具,包括 perf、Ftrace 和 eBPF。
The book BPF Performance Tools: Linux System and Application Observability tours over 100 eBPF performance analysis tools, while including short summaries of the traditional tools. In a way, this is volume 2, and Systems Performance 2nd Edition is volume 1.
BPF 性能工具:Linux 系统和应用程序可观察性](https://www.brendangregg.com/bpf-performance-tools-book.html) 一书介绍了 100 多种 eBPF 性能分析工具,同时还包括传统工具的简短摘要。在某种程度上,这本书是第二卷,而《系统性能第二版》是第一卷。
Generating flame graphs on Linux using perf & eBPF:
CPU Flame Graphs
Off-CPU Flame Graphs
Memory Flame Graphs使用 perf 和 eBPF 在 Linux 上生成火焰图:
CPU 火焰图
非 CPU 火焰图
内存火焰图Posts about eBPF, bcc, and bpftrace (2015-21):
关于 eBPF、bcc 和 bpftrace 的帖子 (2015-21):
Linux eBPF (2015)
bcc: Taming Linux 4.3+ Tracing Superpowers
tcpconnect and tcpaccept for Linux (bcc)
Linux eBPF Stack Trace Hack (bcc) (2016)
Linux eBPF Off-CPU Flame Graph (bcc)
Linux Wakeup and Off-Wake Profiling (bcc)
Linux chain graph prototype (bcc)
Linux eBPF/bcc uprobes
Linux BPF/bcc Road Ahead
Ubuntu Xenial bcc/BPF
Linux bcc/BPF Tracing Security Capabilities
Linux MySQL Slow Query Tracing with bcc/BPF
Linux bcc/BPF ext4 Latency Tracing
Linux bcc/BPF Run Queue (Scheduler) Latency
Linux bcc/BPF Node.js USDT Tracing
Linux bcc tcptop
Linux 4.9’s Efficient BPF-based Profiler
DTrace for Linux 2016
Linux 4.x Tracing Tools: Using BPF Superpowers
Linux bcc/BPF tcplife: TCP Lifespans
Golang bcc/BPF Function Tracing (2017)
7 BPF tools for performance analysis on Fedora
TCP Tracepoints (2018)
Linux bcc/eBPF tcpdrop
bpftrace (DTrace 2.0) for Linux 2018
Learn eBPF Tracing: Tutorial and Examples (2019)
A thorough introduction to bpftrace
BPF: A New Type of Software
BPF Theremin, Tetris, and Typewriters
BPF binaries: BTF, CO-RE, and the future of BPF perf tools (2020)
USENIX LISA2021 BPF Internals (eBPF) (2021)
How To Add eBPF Observability To Your ProductMy lwn.net article Ftrace: The Hidden Light Switch shows a use case for Linux ftrace (Aug, 2014).
我的 lwn.net文章 Ftrace:隐藏的电灯开关 展示了 Linux ftrace 的使用案例(2014 年 8 月)。
Posts about ftrace-based perf-tools (2014-5):
关于基于 ftrace 的 perf 工具的帖子 (2014-5):
iosnoop for Linux, iosnoop Latency Heat Maps, opensnoop for Linux, execsnoop for Linux, ftrace: The Hidden Light Switch, tcpretrans
Page Cache Hit Ratio, uprobe: User-Level Dynamic Tracing, Hacking Linux USDT
- Posts about perf-based perf-tools: perf Hacktogram.
关于基于 perf 的 perf 工具的帖子
- Posts about perf_events (2014-7):
perf CPU Sampling, perf Static Tracepoints, perf Heat Maps, perf Counting, perf Kernel Line Tracing,
perf Off-CPU Time Flame Graphs, Linux Profiling at Netflix, Java Mixed-Mode Flame Graphs (PDF), Linux 4.5 perf folded format,
perf sched for Linux CPU scheduler analysis
A page on Working Set Size Estimation for Linux (2018+).
A post on KPTI/KAISER Meltdown Initial Performance Regressions (2018).
In The PMCs of EC2: Measuring IPC I showed the new Performance Monitoring Counter (PMC) support in the AWS EC2 cloud (2017).
我展示了 AWS EC2 云中新的性能监控计数器(PMC)支持(2017 年)。
CPU Utilization is Wrong: a post explaining the growing problem of memory stall cycles dominating the %CPU metric (2017).
解释了内存停滞周期主导 %CPU 指标这一日益严重的问题(2017 年)。
- A post about Linux 4.7 Hist Triggers (2016).
- The blog post strace Wow Much Syscall discusses strace(1) for production use, and compares it to advanced tracing tools (2014).
讨论了用于生产的 strace(1),并将其与高级跟踪工具进行了比较(2014 年)。
- USE Method: Linux Performance Checklist; also see the USE Method page for the description of this methodology.
另请参阅 USE Method 页面,了解该方法的说明。
- Off-CPU Analysis Method, where I demonstrate this methodology on Linux.
我在 Linux 上演示了这种方法。
Talks
In rough order of recommended viewing or difficulty, intro to more advanced:
按推荐观看或难度从入门到高级的大致顺序排列:
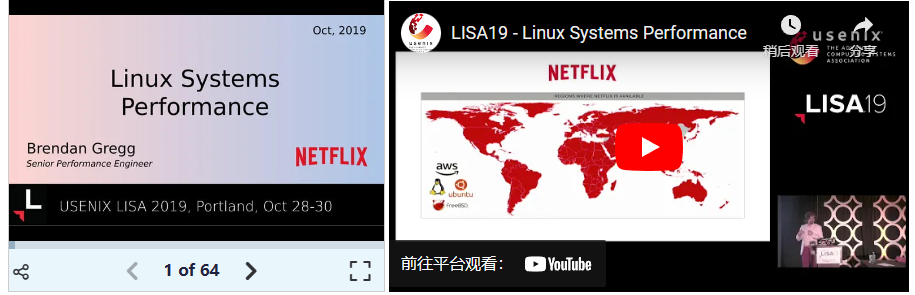
1. Linux Systems Performance (USENIX LISA 2019)
This is my summary of Linux systems performance in 40 minutes, covering six facets: observability, methodologies, benchmarking, profiling, tracing, and tuning. It’s intended for everyone as a tour of fundamentals, and some companies have indicated they will use it for new hire training.
这是我在 40 分钟内对 Linux 系统性能的总结,涵盖六个方面:可观察性、方法、基准测试、剖析、跟踪和调整。它面向所有人,是基础知识的巡礼,一些公司表示将把它用于新员工培训。
A video of the talk is on usenix.org and youtube, and the slides are on slideshare or as a PDF
讲座视频可在 usenix.org 和 youtube 上观看,幻灯片可在 slideshare 或 PDF 上观看。
For a lot more information on observability tools, profiling, and tracing, see the talks that follow.
有关可观察性工具、剖析和跟踪的更多信息,请参阅后面的讲座。
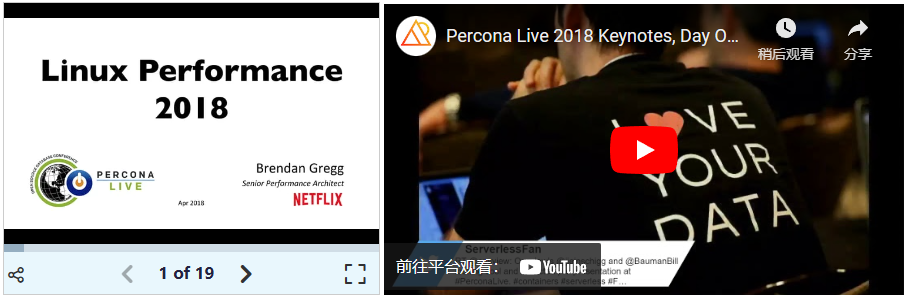
2. Linux Performance 2018 (PerconaLive 2018)
This was a 20 minute keynote summary of recent changes and features in Linux performance in 2018.
这是一个 20 分钟的主题演讲,总结了 2018 年 Linux 性能方面的最新变化和功能。
A video of the talk is on youtube, and the slides are on slideshare or as a PDF.
讲座视频可在 youtube 上观看,幻灯片可在 slideshare 上观看,也可下载 PDF.
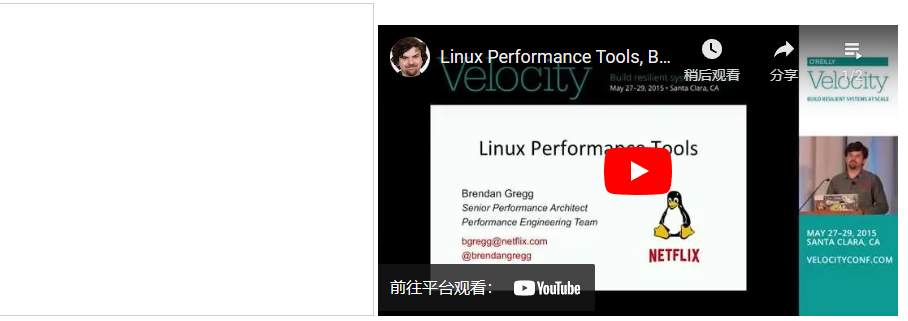
3. Linux Performance Tools (Velocity 2015)
At Velocity 2015, I gave a 90 minute tutorial on Linux performance tools, summarizing performance observability, benchmarking, tuning, static performance tuning, and tracing tools. I also covered performance methodology, and included some live demos. This should be useful for everyone working on Linux systems. If you just saw my PerconaLive2016 talk, then some content should be familiar, but with many extras: I focus a lot more on the tools in this talk.
在Velocity 2015大会上,我做了90分钟的Linux性能工具教程,总结了性能可观测性、基准测试、调优、静态性能调优和跟踪工具。我还介绍了性能方法论,并包括一些现场演示。这对每个在 Linux 系统上工作的人都很有用。如果您刚刚看过我的 PerconaLive2016 演讲,那么有些内容应该不会陌生,但还有很多额外的内容: 在本讲座中,我更关注工具。
A video of the talk is on youtube (playlist; part 1, part 2) and the slides are on slideshare or as a PDF.
讲座视频可在 youtube 上观看(播放列表;第一部分,第二部分),幻灯片可在 slideshare 或 PDF 上观看。
幻灯片失效了,视频貌似还有用
This was similar to my SCaLE11x and LinuxCon talks, however, with 90 minutes I was able to cover more tools and methodologies, making it the most complete tour of the topic I’ve done. I also posted about it on the Netflix Tech Blog.
这与我的SCaLE11x 和LinuxCon 演讲类似,不过,在 90 分钟的时间里,我可以介绍更多的工具和方法,这是我做过的最完整的一次演讲。我还在 Netflix 技术博客 上发布了相关内容。
4. How Netflix Tunes EC2 Instances for Performance (AWS re:Invent, 2017)
Instead of performance observability, this talk is about tuning. I begin by providing Netflix background, covering instance types and features in the AWS EC2 cloud, and then talk about Linux kernel tunables and observability.
本讲座的主题不是性能可观测性,而是调优。首先,我将介绍 Netflix 的背景,涵盖 AWS EC2 云的实例类型和功能,然后谈谈 Linux 内核可调性和可观测性。
A video of the talk is on youtube and the slides are on slideshare:
讲座视频在 youtube 上,幻灯片在 slideshare 上:

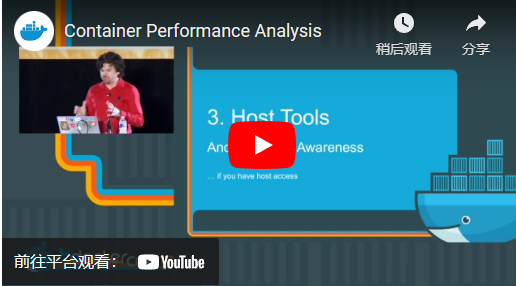
5. Container Performance Analysis (DockerCon, 2017)
At DockerCon 2017 in Austin, I gave a talk on Linux container performance analysis, showing how to find bottlenecks in the host vs the container, how to profiler container apps, and dig deeper into the kernel.
在奥斯汀举行的 DockerCon 2017 上,我发表了关于 Linux 容器性能分析的演讲,展示了如何找到主机与容器的瓶颈,如何对容器应用程序进行剖析,以及如何深入挖掘内核。
A video of the talk is on youtube and the slides are on slideshare.
讲座视频在 youtube 上,幻灯片在 slideshare 上。
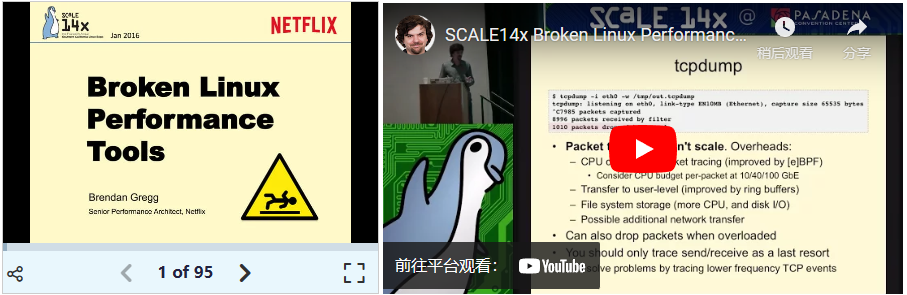
6. Broken Linux Performance Tools (SCaLE14x, 2016)
At the Southern California Linux Expo (SCaLE 14x), I gave a talk on Broken Linux Performance Tools. This was a follow-on to my earlier Linux Performance Tools talk originally at SCaLE11x (and more recently at Velocity as a tutorial). This broken tools talk was a tour of common problems with Linux system tools, metrics, statistics, visualizations, measurement overhead, and benchmarks. It also includes advice on how to cope (the green “What You Can Do” slides).
在南加州Linux博览会(SCaLE 14x)上,我做了一个关于破碎的Linux性能工具的演讲。这是我之前在SCaLE11x上发表的Linux性能工具演讲(最近在Velocity上作为教程发表)的后续演讲。这篇 “破损的工具 “演讲讲述了 Linux 系统工具、度量、统计、可视化、测量开销和基准的常见问题。其中还包括应对建议(绿色的 “你能做什么 “幻灯片)。
A video of the talk is on youtube and the slides are on slideshare or as a PDF.
7. Using Linux perf at Netflix (Kernel Recipes, 2017)
At Kernel Recipes 2017 I gave an updated talk on Linux perf at Netflix, focusing on getting CPU profiling and flame graphs to work. This talk includes a crash course on perf_events, plus gotchas such as fixing stack traces and symbols when profiling Java, Node.js, VMs, and containers.
在 Kernel Recipes 2017 上,我发表了关于 Netflix Linux perf 的最新演讲,重点是如何让 CPU 剖析和火焰图发挥作用。本讲座包括 perf_events 的速成课程,以及在剖析 Java、Node.js、虚拟机和容器时修复堆栈跟踪和符号等疑难问题。
A video of the talk is on youtube and the slides are on slideshare:
讲座视频在 youtube 上,幻灯片在 slideshare 上:
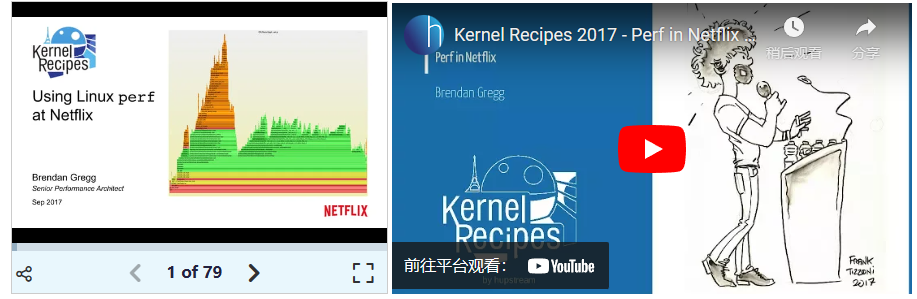
There’s also an older version of this talk from 2015, which I’ve posted about. To learn more about flame graphs, see my flame graphs presentation.
这个讲座还有一个 2015 年的旧版本,我已经发布了。要了解有关火焰图的更多信息,请参阅我的 火焰图演示。
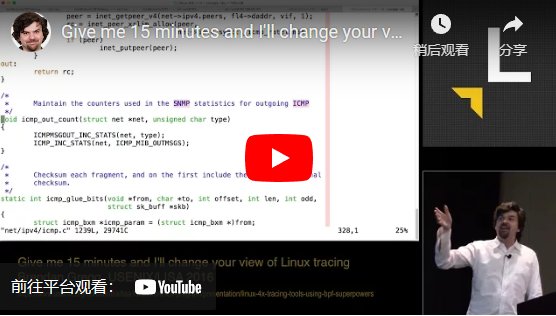
8. Give me 15 minutes and I’ll change your view of Linux tracing (LISA, 2016)
I gave this demo at USENIX/LISA 2016, showing ftrace, perf, and bcc/BPF. A video is on youtube (sorry, the sound effects are a bit too loud):.
我在 USENIX/LISA 2016 上做了这个演示,展示了 ftrace、perf 和 bcc/BPF。视频在 youtube(抱歉,音效有点大):。
This was the first part of a longer talk on Linux 4.x Tracing Tools: Using BPF Superpowers. See the full talk video and talk slides.
这是关于 Linux 4.x 跟踪工具的长篇演讲的第一部分: 使用 BPF 超强功能。请参阅完整的 讲座视频 和 讲座幻灯片。
9. Performance analysis superpowers with Linux eBPF (O’Reilly Velocity, 2017)
This talk covers using enhanced BPF (aka eBPF) features added to the Linux 4.x series for performance analysis, observability, and debugging. The front-end used in this talk is bcc (BPF compiler collection), an open source project that provides BPF interfaces and a collection of tools.
本讲座将介绍如何使用 Linux 4.x 系列新增的增强型 BPF(又称 eBPF)功能进行性能分析、可观察性和调试。本讲座中使用的前端是 bcc(BPF 编译器集合),它是一个提供 BPF 接口和工具集合的开源项目。
A video of the talk is on youtube, and the slides are on slideshare or as a PDF.
讲座视频在 youtube 上,幻灯片在 slideshare 或 PDF 上。
10. Linux Performance Analysis: New Tools and Old Secrets (ftrace) (LISA 2014)
At USENIX LISA 2014, I gave a talk on the new ftrace and perf_events tools I’ve been developing: the perf-tools collection on github, which mostly uses ftrace: a tracer that has been built into the Linux kernel for many years, but few have discovered (practically a secret).
在 2014 年的 USENIX LISA 大会上,我发表了关于我一直在开发的新 ftrace 和 perf_events 工具的演讲:github 上的 perf-tools 套件,其中大部分使用了 ftrace:这是一个内置于 Linux 内核多年的跟踪器,但很少有人发现它(实际上是一个秘密)。
A video of the talk is on youtube, and the slides are on slideshare or as a PDF. In a post about this talk, I included some more screenshots of these tools in action.
演讲视频在 youtube 上,幻灯片在 slideshare 或 PDF 上。在一篇关于本讲座的帖子中,我还附上了这些工具的截图。
11. Performance Checklists for SREs (SREcon, 2016)
At SREcon 2016 Santa Clara, I gave the closing talk on performance checklists for SREs (Site Reliability Engineers). The later half of this talk included Linux checklists for incident performance response. These may be useful whether you’re analyzing Linux performance in a hurry or not.
在SREcon 2016 Santa Clara上,我做了关于站点可靠性工程师(SRE)性能检查表的闭幕演讲。演讲的后半部分包括用于事件性能响应的 Linux 检查单。无论您是否在匆忙中分析 Linux 性能,这些清单都可能很有用。
A video of the talk is on youtube and usenix, and the slides are on slideshare and as a PDF. I included the checklists in a blog post.
讲座视频在 youtube 和 usenix 上,幻灯片在 slideshare 和 PDF 上。我在一篇博文中附上了核对表。
Resources 相关资源
Other resources (not by me) I’d recommend for the topic of Linux performance:
关于 Linux 性能主题,我想推荐的其他资源(不是我写的):
- Performance analysis & tuning of Red Hat Enterprise Linux - 2015 Red Hat Summit (video 2hrs): this is a great and in-depth tour of Linux performance tuning that should be largely applicable to all Linux distros.
红帽企业 Linux 的性能分析与调优 - 2015 红帽峰会(视频 2 小时):这是一次深入浅出的 Linux 性能调整之旅,在很大程度上适用于所有 Linux 发行版。
(视频 2 小时):这是一次深入浅出的 Linux 性能调整之旅,在很大程度上适用于所有 Linux 发行版。
- Linux Instrumentation: slides from a great talk in June 2010 by Ian Munsie, which summarizes the different Linux tracers very well. If you’re trying to understand all the tracers and frameworks, this is worth studying (keeping in mind it’s from 2010).
这是 Ian Munsie 于 2010 年 6 月发表的精彩演讲的幻灯片,其中很好地总结了不同的 Linux 跟踪器。如果您正试图了解所有跟踪器和框架,那么这篇文章值得一读(请注意这是 2010 年的文章)。
- Julia Evans blog has many posts about many topics, including performance tools.
有许多关于性格讨论等问题的帖子,包括性能工具。
- Davidlohr Bueso’s Linux performance posts.
Linux 性能讨论文章。